**Tweezer Bottom Pattern Kya Hai?**
Tweezer Bottom pattern ek popular candlestick pattern hai jo technical analysis mein use hota hai. Yeh pattern market ke potential reversal points ko identify karne ke liye useful hai aur typically bearish trends ke baad bullish reversal ko signal karta hai. Is post mein, hum Tweezer Bottom pattern ko detail se samjhenge aur dekhenge ke yeh trading decisions mein kaise madadgar hota hai.
**Tweezer Bottom Pattern Kya Hai?**
Tweezer Bottom pattern do candlesticks par contain hota hai jo ek specific price action aur formation ko represent karte hain. Yeh pattern market ke oversold conditions aur potential reversal ko indicate karta hai. Tweezer Bottom pattern ka shape aur characteristics kuch is tarah hote hain:
1. **Two Candlesticks**: Tweezer Bottom pattern mein do candlesticks hoti hain jo ek doosre ke saath match karti hain. Pehli candlestick ek long bearish (down) candlestick hoti hai, aur doosri candlestick ek similar length ki bullish (up) candlestick hoti hai. Dono candlesticks ka low level ek hi hota hai ya almost same hota hai.
2. **Price Reversal Signal**: Yeh pattern market ke bearish trend ke baad banta hai aur yeh indicate karta hai ke market oversold ho chuki hai aur reversal hone ka potential hai. Doosri candlestick ke bullish close ke baad, market mein buying pressure increase hota hai, jo potential uptrend ko signal karta hai.
**Pattern Key Features:**
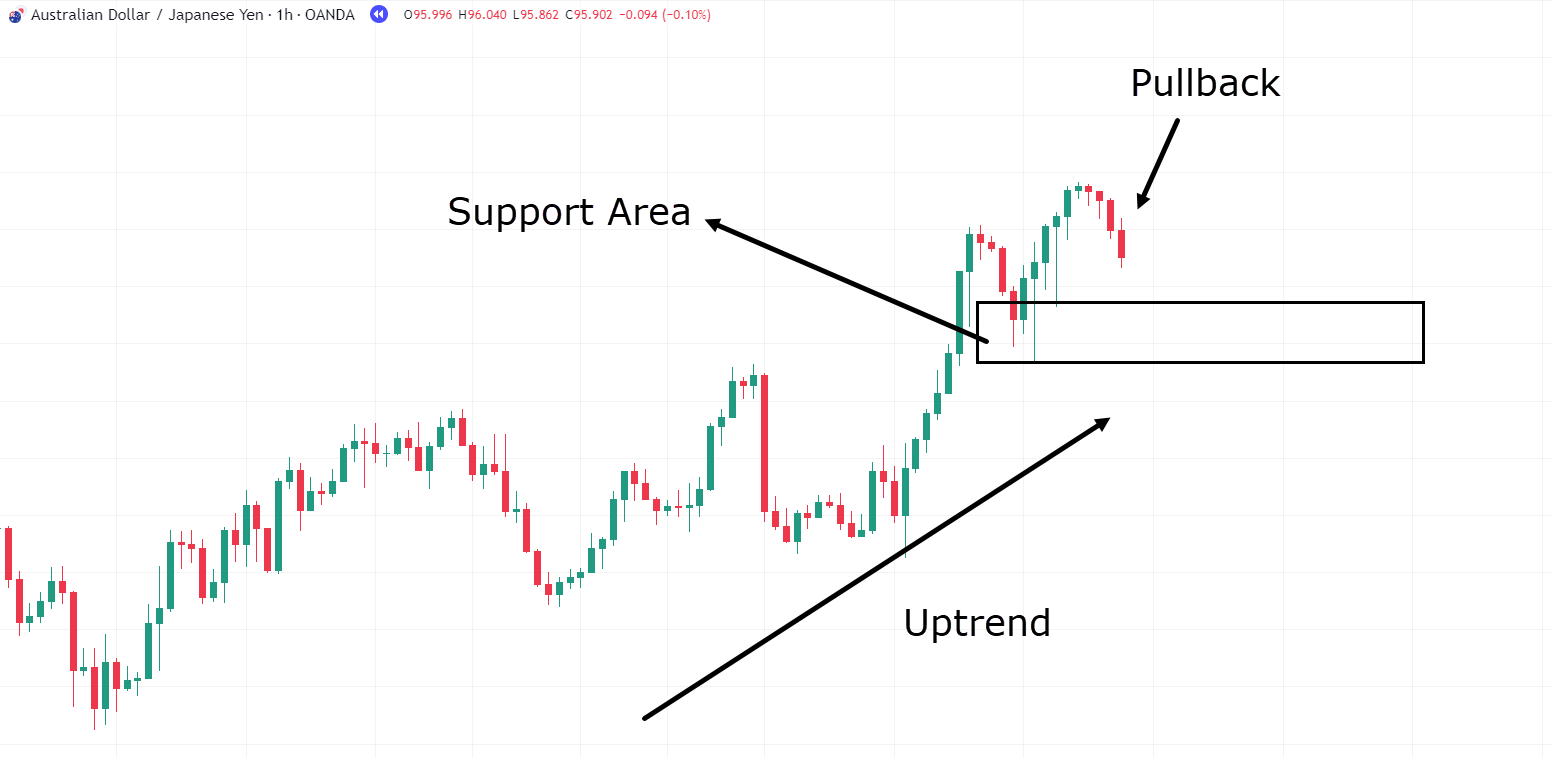
1. **Support Level**: Tweezer Bottom pattern typically ek significant support level ke paas banta hai. Yeh support level market ke potential reversal point ko indicate karta hai. Agar pattern support level ke paas develop hota hai, to yeh confirmation signal hota hai ke market ke direction badal sakti hai.
2. **Volume Analysis**: Volume bhi Tweezer Bottom pattern ki validity ko confirm karne mein madad karta hai. Doosri candlestick ke bullish close ke waqt volume ka increase bullish signal ko aur strong banata hai. Volume ka increase buying interest aur trend reversal ko confirm karta hai.
3. **Confirmation**: Tweezer Bottom pattern ki effectiveness ko confirm karne ke liye, traders ko pattern ke completion ke baad price ke movement aur other technical indicators ko bhi analyze karna chahiye. Ek strong confirmation signal pattern ke effectiveness ko enhance kar sakta hai.
**Trading Strategy:**
1. **Entry Points**: Tweezer Bottom pattern ke complete hone ke baad, traders buying positions enter kar sakte hain. Doosri candlestick ke bullish close ke baad market mein buying pressure increase hota hai, jo potential uptrend ko indicate karta hai.
2. **Stop-Loss**: Risk management ke liye, stop-loss orders use kiye jate hain. Tweezer Bottom pattern ke niche support level ke 1-2% below stop-loss set karke, aap potential losses ko minimize kar sakte hain.
3. **Target Price**: Target price ko Tweezer Bottom pattern ke formation ke baad market ke next resistance levels ko identify karke set kiya jata hai. Yeh potential profit levels ko estimate karne mein madad karta hai.
**Conclusion:**
Tweezer Bottom pattern ek effective candlestick pattern hai jo bearish trends ke baad bullish reversal ko indicate karta hai. Yeh pattern market ke potential reversal points ko identify karne aur trading decisions ko enhance karne mein madad karta hai. Accurate analysis aur confirmation signals ke sath, traders is pattern ka maximum benefit le sakte hain aur informed trading strategies develop kar sakte hain.


تبصرہ
Расширенный режим Обычный режим